
Marketers often say that storytelling in your content helps to hook readers in. So here’s the deal…
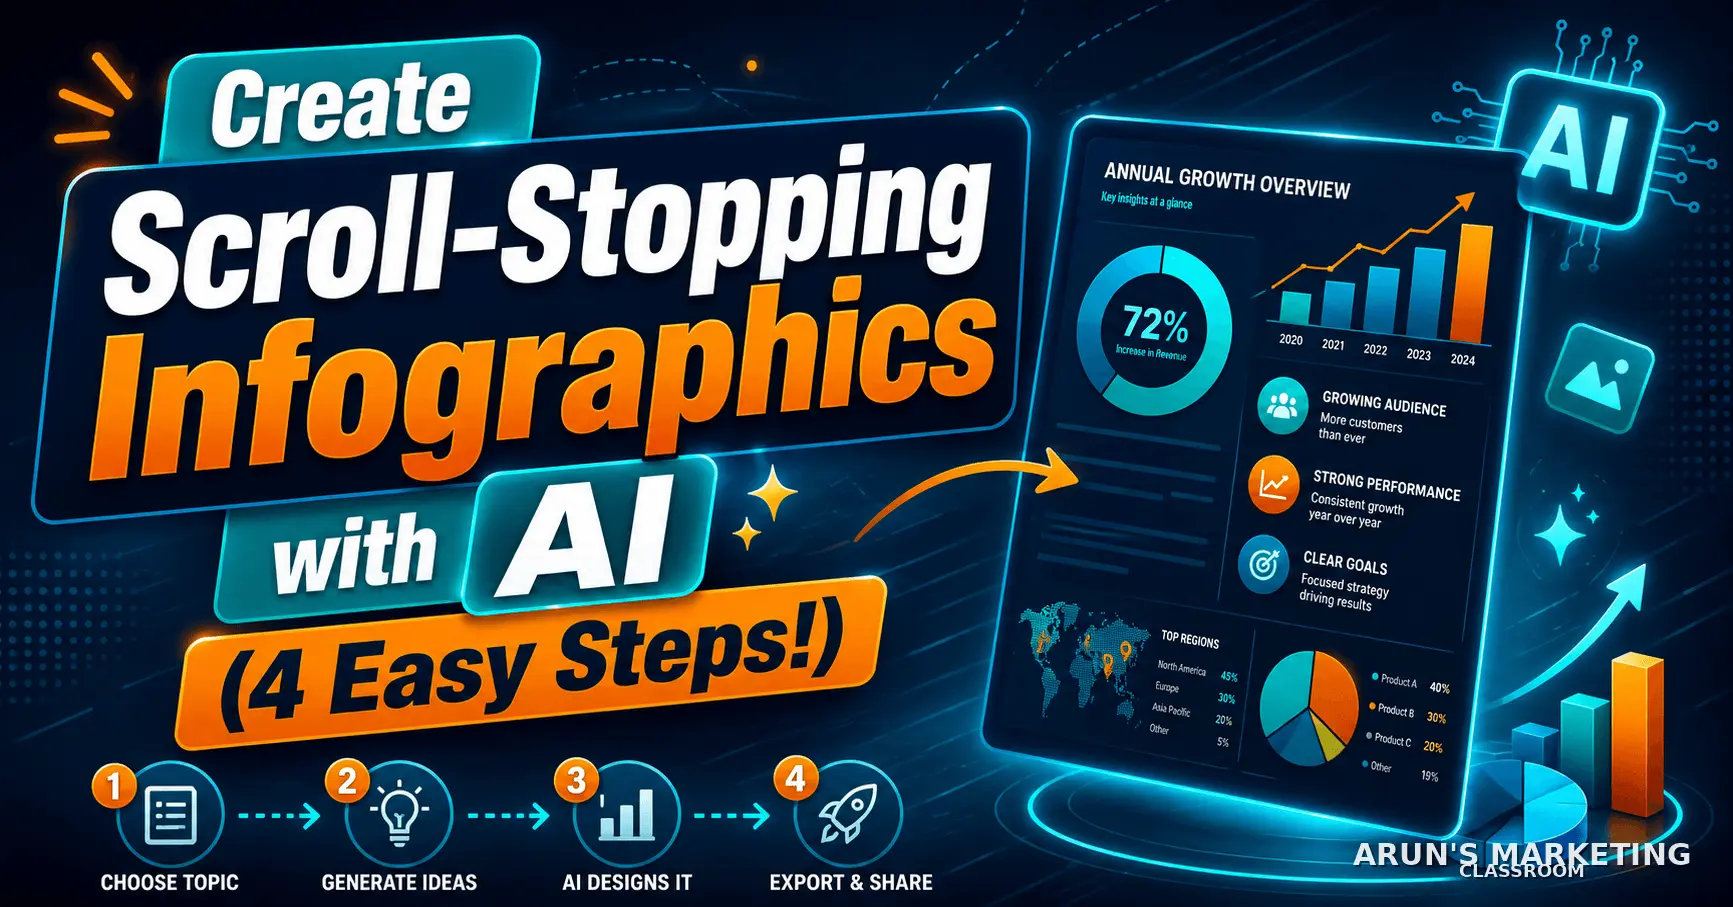
If you need a story from me to learn how to create fantastic infographics with AI in 4 easy steps – just refer to the image below.

You still here?
Excellent. Let’s begin!
Step #1: Choose the Type of Infographic You Want to Create
There are many different infographic styles out there. The good news is that you don’t need to know any of them.
What are we? Designer nerds? PFFT! We have ChatGPT.
Below you’ll see 30 different types of infographics. I just asked Chatty to give me this rubbish list. Don’t panic. We’ll still win with it.
- Timeline infographic
- Process infographic
- Comparison infographic
- Data visualization infographic
- Statistical infographic
- List infographic
- How-to infographic
- Flowchart infographic
- Roadmap infographic
- Checklist infographic
- Carousel infographic
- Minimalist infographic
- Bold typography infographic
- Isometric infographic
- 3D infographic
- Flat vector infographic
- Retro/vintage infographic
- Editorial magazine-style infographic
- Dashboard-style infographic
- Map infographic
- Pyramid infographic
- Funnel infographic
- Before-and-after infographic
- Myth vs. fact infographic
- Problem-solution infographic
- Case study infographic
- AI/futuristic infographic
- Social media infographic
- Hand-drawn infographic
- Line-art infographic
If you don’t know what the different infographics look like, just use this prompt: “Give me a sample [infographic name] so I know what one looks like.”
You can decide if you want a vertical or landscape-oriented infographic.
Since I didn’t know what the hell a ‘timeline infographic’ was, I asked Chatty…
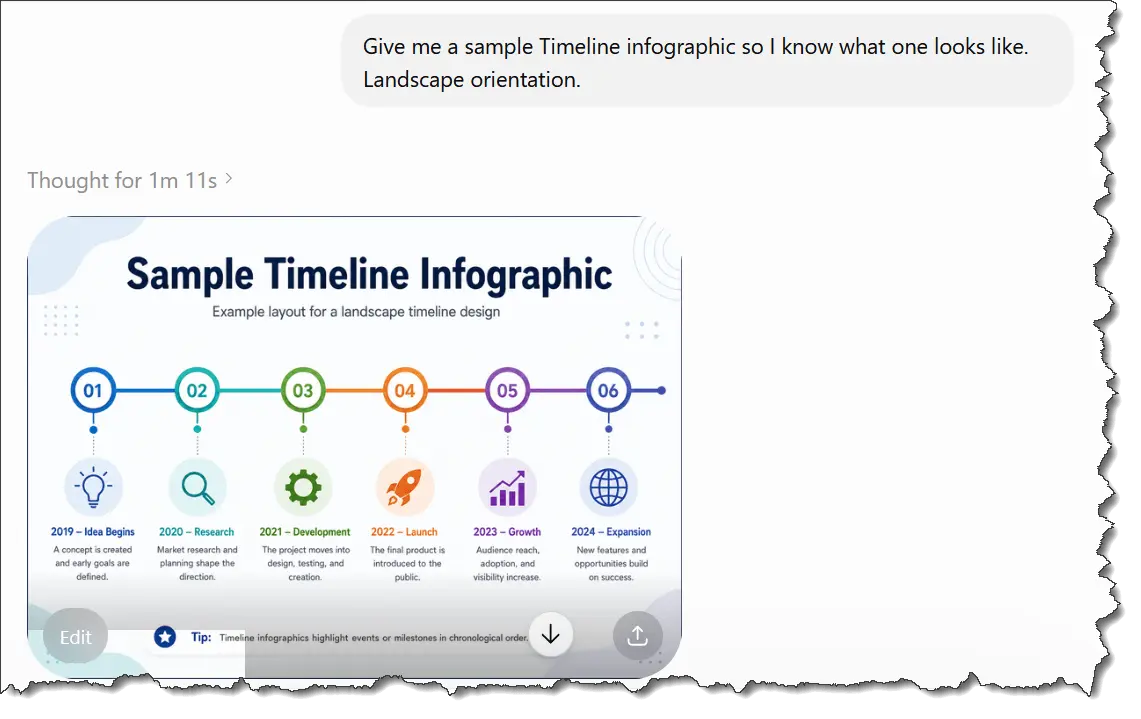
Now I know.
Your action step: Choose an infographic style you like.
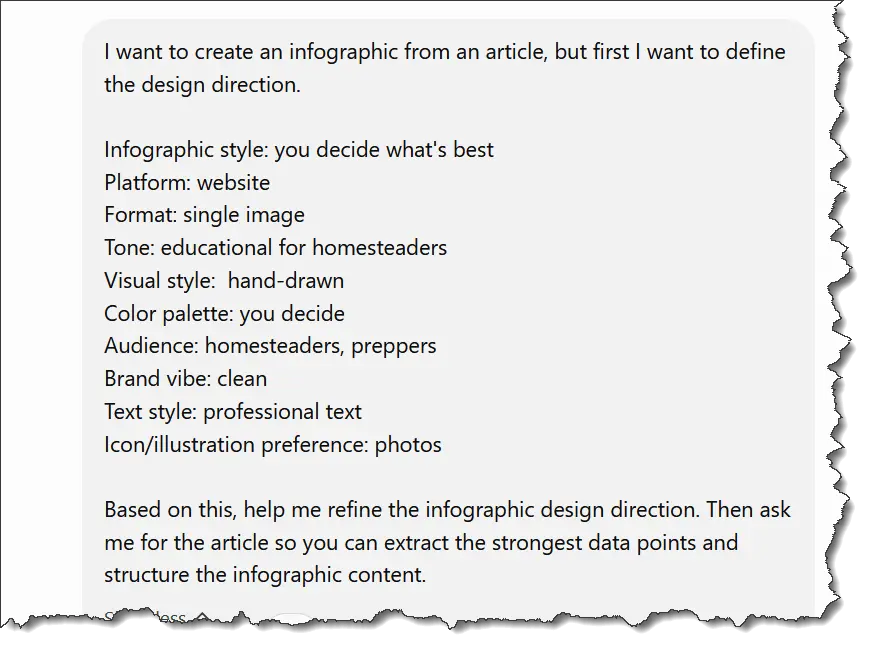
Step #2: Fill Out the Details in the Prompt Below
Just fill in the sections that apply to you.
The Prompt
I want to create an infographic from an article, but first I want to define the design direction.
Infographic style: [timeline / checklist / comparison / roadmap / carousel / flowchart / statistical / minimalist / bold typography / 3D / flat vector / editorial / etc.]
Platform: [Instagram / Facebook / LinkedIn / Pinterest / blog / website]
Format: [single image / carousel / vertical infographic / square post / story size]
Tone: [serious / playful / inspirational / educational / premium / bold / futuristic / emotional]
Visual style: [cartoon / minimalist / corporate / editorial / 3D / flat vector / hand-drawn / luxury / modern]
Color palette: [brand colors or preferred colors]
Audience: [who this is for]
Brand vibe: [clean / fun / dramatic / premium / modern / friendly / high-energy]
Text style: [short punchy text / professional text / emotional captions / bold headline-heavy]
Icon/illustration preference: [icons / characters / charts / abstract shapes / photos / no illustrations]
Design references: [optional — describe or paste examples]
Based on this, help me refine the infographic design direction. Then ask me for the article so you can extract the strongest data points and structure the infographic content.
Step #3: Add Your Content
Once you give ChatGPT your prompt, it’ll ask you for the content.
You could give it an article, a short report, or your birth certificate. It’s up to you. Chatty just needs the content to extract the data points.
For this example, I’ll use a PLR article about homesteading.
This article was created by one of the best PLR vendors I know – ME!
Let’s fire up Chatty!
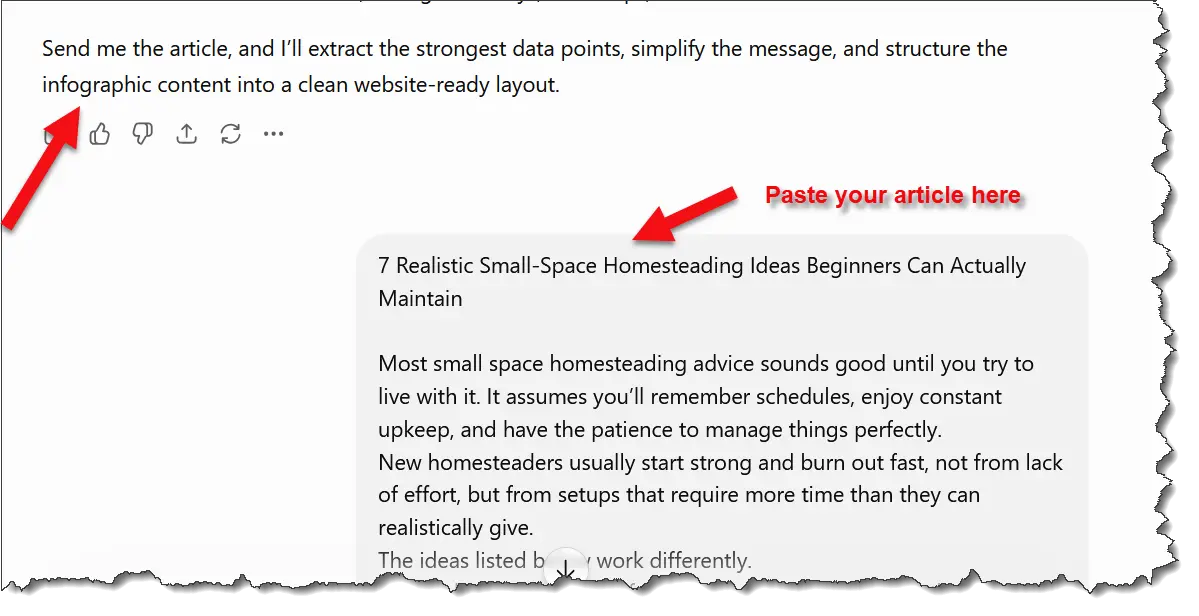
If ChatGPT babbles some BS about concepts and stuff, just ask it to generate the image.
And this is what it created.
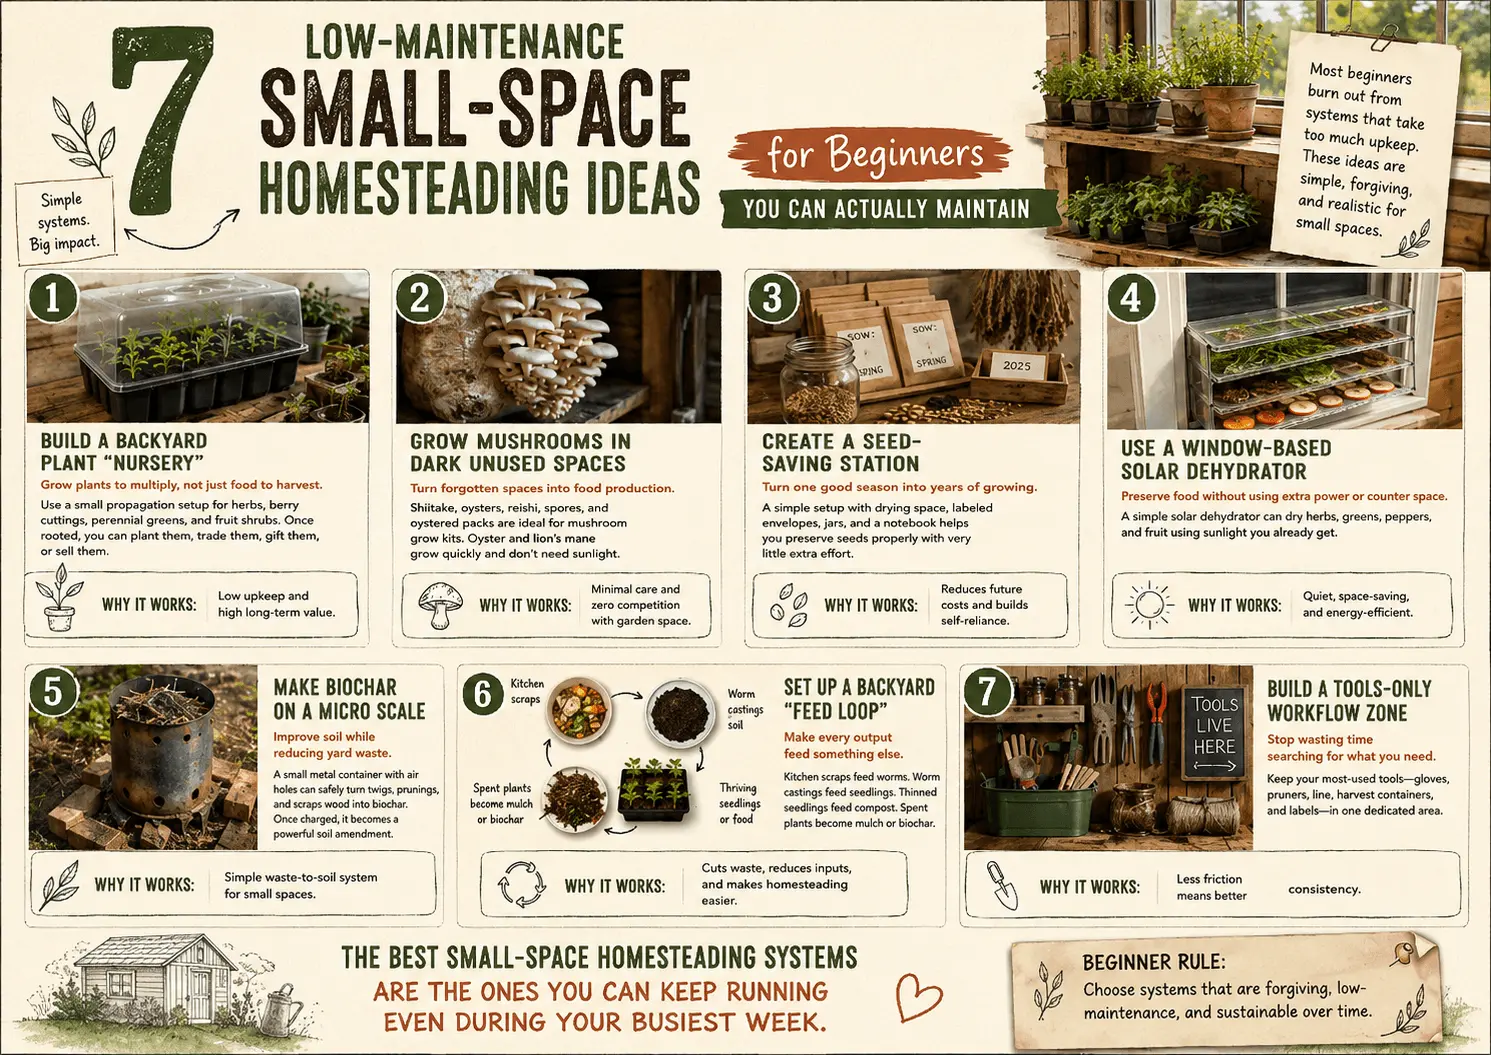
Wonderful!
Just for the Hell of It…
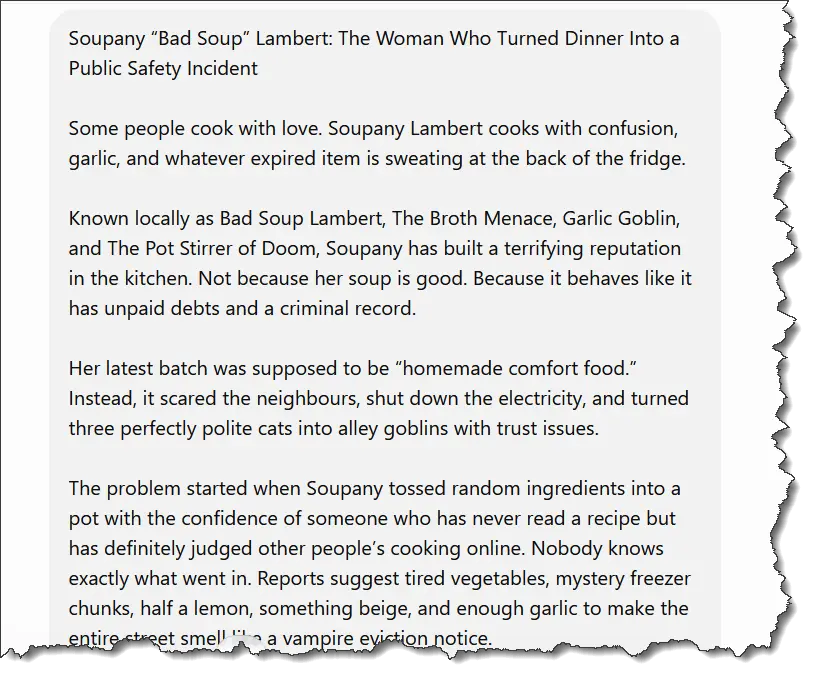
Now, let me see if I can create an infographic about Liffany Tambert and her bad soup.
I’ll use the same prompt with different options and give it a story about her soup… HA!
Chatty is as versatile as ever and created this masterpiece!
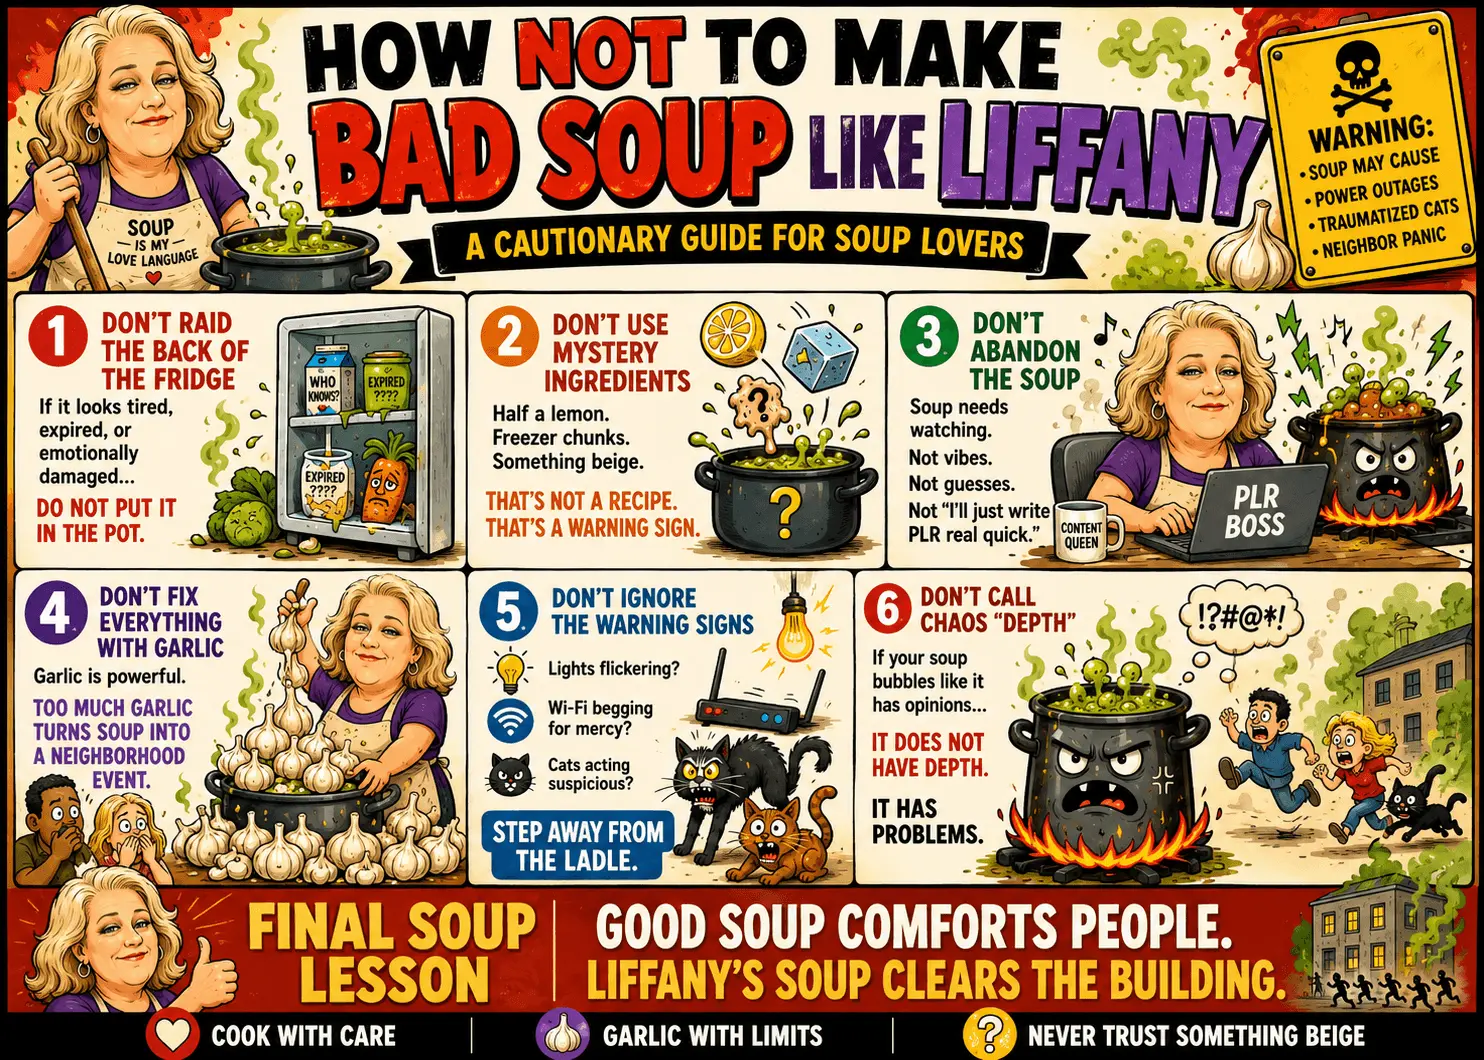
Pure brilliance right here!
Step #4 – Pretend You’re an Awesome Designer!
See? Now you can design infographics in minutes.
If that’s not a reason to brag, I don’t know what is.

Until next time… Bye.